We need to add some data members and member functions to the Chain class in order for each chain to do its part in computing the marginal likelihood. In the declaration of the class, add data members _heat_likelihood_only, _next_heating_power, and _ss_loglikes, and member functions setNextHeatingPower, storeLogLikelihood, and calcLogSteppingstoneRatio.
class Chain {
friend class Likelihood;
public:
typedef std::vector<Updater::SharedPtr> updater_vect_t;
typedef std::shared_ptr<Chain> SharedPtr;
Chain();
~Chain();
void clear();
void startTuning();
void stopTuning();
void setTreeFromNewick(std::string & newick);
unsigned createUpdaters(Model::SharedPtr model, Lot::SharedPtr lot, Likelihood::SharedPtr likelihood);
TreeManip::SharedPtr getTreeManip();
Model::SharedPtr getModel();
double getLogLikelihood() const;
void setHeatingPower(double p);
double getHeatingPower() const;
<span style="color:#0000ff"><strong>void setNextHeatingPower(double p);</strong></span>
<span style="color:#0000ff"><strong>void storeLogLikelihood();</strong></span>
<span style="color:#0000ff"><strong>double calcLogSteppingstoneRatio() const;</strong></span>
void setChainIndex(unsigned idx);
double getChainIndex() const;
Updater::SharedPtr findUpdaterByName(std::string name);
std::vector<std::string> getUpdaterNames() const;
std::vector<double> getAcceptPercentages() const;
std::vector<unsigned> getNumUpdates() const;
std::vector<double> getLambdas() const;
void setLambdas(std::vector<double> & v);
double calcLogLikelihood() const;
double calcLogJointPrior() const;
void start();
void stop();
void nextStep(int iteration);
private:
Model::SharedPtr _model;
Lot::SharedPtr _lot;
TreeManip::SharedPtr _tree_manipulator;
updater_vect_t _updaters;
unsigned _chain_index;
double _heating_power;
<span style="color:#0000ff"><strong>bool _heat_likelihood_only;</strong></span>
<span style="color:#0000ff"><strong>double _next_heating_power;</strong></span>
<span style="color:#0000ff"><strong>std::vector<double> _ss_loglikes;</strong></span>
double _log_likelihood;
};
Initialize the new data members in the clear function:
    inline void Chain::clear() {
        _log_likelihood = 0.0;
        _updaters.clear();
        _chain_index = 0;
        setHeatingPower(1.0);
        <span style="color:#0000ff"><strong>_heat_likelihood_only = false;</strong></span>
        <span style="color:#0000ff"><strong>_next_heating_power = 1.0;</strong></span>
        <span style="color:#0000ff"><strong>_ss_loglikes.clear();</strong></span>
        startTuning();
    }
The setNextHeatingPower function
This function sets the _heat_likelihood_only data member to true and the _next_heating_power data member to the supplied power p. It also informs all updaters that only the likelihood should be raised to a power, not the prior. Steppingstone power posteriors differ from Metropolis-coupled Markov chains in that only the likelihood is raised to a power. In MCMCMC, the entire posterior kernel is heated. Because setNextHeatingPower is only called when doing steppingstone, this function provides a convenient place to make sure all the updaters know that we are doing steppingstone-style heating. I will explain why each chain needs to know not only its own heating power but also the heating power of the next power posterior nested within it when I discuss the calcLogSteppingstoneRatio function below.
    inline void Chain::setNextHeatingPower(double p) {
        _heat_likelihood_only = true; // next heating power only set if doing steppingstone
        for (auto u : _updaters)
            u->setHeatLikelihoodOnly(true);
        _next_heating_power = p;
    }
The storeLogLikelihood function
This is a simple function that simply adds the current log likelihood to the end of the _ss_loglikes vector.
    inline void Chain::storeLogLikelihood() {
        double logLike = getLogLikelihood();
        _ss_loglikes.push_back(logLike);
    }
The calcLogSteppingstoneRatio function
This function is neither long nor complicated, but I need to provide some explanation if you are to understand how it works. I have described the steppingstone method as basically throwing darts randomly and uniformly within the area defined by one power posterior and then counting how many of those darts fall underneath the next power posterior nested within. That metaphor is very useful for gaining an intuitive understanding, but, in practice, the steppingstone uses a modification that is more efficient. Instead of choosing both an x-coordinate (i.e. a point in parameter space) as well as a y-coordinate for each dart (by choosing a point uniformly between 0 and the outer power posterior density), then looking to see whether the y-coordinate is also beneath the inner power posterior, we will instead just choose a point in parameter space and compute the expected fraction of darts that would fall under the inner power posterior were we to actually throw them! It’s as if we are throwing an infinite number of darts for each parameter value sampled, and effectively gives us an infinitely large sample size for free. First, I’ll show you the function body and then I’ll explain.
    inline double Chain::calcLogSteppingstoneRatio() const {
        // Find the maximum log likelihood sampled by this chain
        unsigned sample_size = (unsigned)_ss_loglikes.size();
        assert(sample_size > 0);
        double maxLogL = *(std::max_element(_ss_loglikes.begin(), _ss_loglikes.end()));

        // Compute sum, factoring out maxLnL
        double sum_of_terms = 0.0;
        for (auto logL : _ss_loglikes) {
            sum_of_terms += exp((_next_heating_power - _heating_power)*(logL - maxLogL));
        }

        // Compute the log of the steppingstone ratio
        assert(sum_of_terms > 0.0);
        double log_ratio = (_next_heating_power - _heating_power)*maxLogL + log(sum_of_terms) - log(sample_size);
        return log_ratio;
    }
At the time this function is called (within Strom::calcMarginalLikelihood), the _ss_loglikes vector is full of sampled log likelihoods. Each of these values represents the log likelihood of a point sampled from the particular power posterior distribution that the chain has implemented. That log likelihood is associated with a particular point. Here are a couple of power posterior distributions showing some darts thrown at the larger (enclosing) distribution:
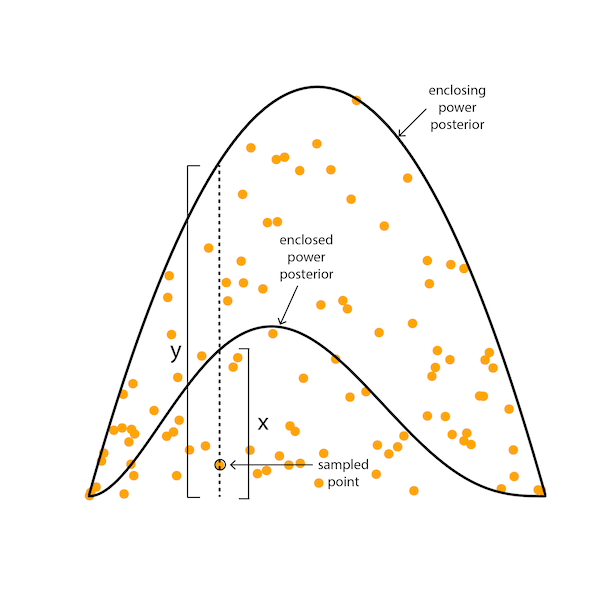
The x-coordinates of the orange dots represent sampled points from that enclosing power posterior distribution. Thus, we can obtain the x-coordinates of the darts just from recording the points visited by the chain that is exploring that enclosing distribution. The y-coordinate of the sampled orange dot could be obtained by sampling uniformly from the interval represented by the vertical dotted line, which extends from zero up to the height of the enclosing power posterior density at the sampled point. Imagine sampling not just one point along that dotted line, but instead sampling an infinite number of points uniformly along that line. The fraction of points sampled with that same x-coordinate that are underneath the enclosed power posterior density is just the height of the enclosed power posterior density (labeled x) divided by the height of the enclosing power posterior density (labeled y). So, we can simulate throwing an infinite number of darts at the larger power posterior and counting the fraction that lie beneath the smaller, nested power posterior by sampling x-coordinates and, for each, computing the ratio of power posterior densities!
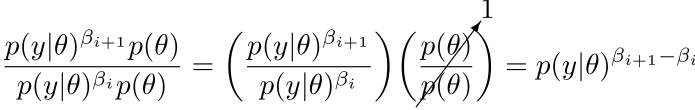
The ratio of power posteriors is the ratio of likelihoods multiplied by the ratio of priors. Because the prior is the same for both (remember, the prior is not heated), the ratio of priors equals 1. So, to compute the ratio of the enclosed to the enclosing power posterior density, we need only compute the likelihood and raise it to a power equal to the difference in heating powers:
Thus, an estimate of the ratio (“steppingstone’) needed for this particular chain can be obtained by raising each sampled likelihood by the difference in chain heating powers, _next_heating_power - _heating_power and computing the simple average.
A perusal of the code above for the calcLogSteppingstoneRatio function shows, however, that something more complicated is being done. The problem is that the average computed the simple way can be numerically unstable. We must avoid leaving the log scale for likelihoods because, for all but the smallest of data sets, underflow will turn these tiny likelihoods into 0. How do you compute a sum when the elements you are summing together must all stay on the log scale?
The way to solve this problem is to factor out the largest term (assume that the largest term is c in the example below):
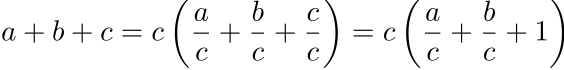
That doesn’t solve our problem, however, because a, b, and c are not on the log scale. Here’s how we can fix that:
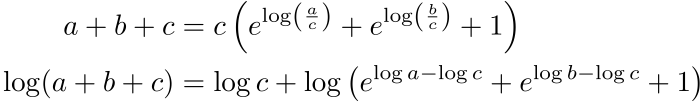 Now we have the log of the sum on the left, and on the right side a, b, and c are all present only on log scale. Now it doesn’t matter if some of the terms of the sum on the right underflow because those terms represent likelihoods that were so much smaller than the largest value that they would not have made any measurable difference to the sum anyway.
Now you should be in a position to understand the body of the calcLogSteppingstoneRatio function. The function first finds the largest log likelihood stored in the _ss_loglikes vector (this is analogous to finding the value c in the example above). The value returned by std::max_element is an iterator, not a value, so the initial asterisk is necessary to dereference (i.e. obtain the value pointed to by) the iterator).
The next section computes the sum of the exponentiated terms. The only difference between this section and our example is the fact that the ratio of log likelihoods is being raised to the power _next_heating_power - _heating_power, which is an essential part of the steppingstone method.
The final section finishes the computation of the log ratio by adding the log of the largest term (also raised to the power specified by the steppingstone method and converting the sum to a mean by dividing by the sample size (which is done by subtracting the log of the sample size since we are on the log scale).